

Comprehensive Guide to Lithium-Ion Battery Discharge Curve Analysis
By hoppt

The most commonly used performance test of lithium-ion battery- -the discharge curve analysis strategy
When the lithium-ion battery discharges, its working voltage always changes constantly with the continuation of time. The working voltage of the battery is used as the ordinate, discharge time, or capacity, or state of charge (SOC), or discharge depth (DOD) as the abscissa, and the curve drawn is called the discharge curve. To understand the discharge characteristic curve of a battery, we first need to understand the voltage of the battery in principle.
[Voltage of the battery]
For the electrode reaction to form the battery must meet the following conditions: the process of losing the electron in the chemical reaction (i. e. oxidation process) and the process of obtaining the electron (i. e. reduction reaction process) must be separated in two different areas, which is different from the general redox reaction; the redox reaction of the active substance of two electrodes must be transmitted by the external circuit, which is different from the microbattery reaction in the metal corrosion process. The voltage of the battery is the potential difference between the positive electrode and the negative electrode. The specific key parameters include open circuit voltage, working voltage, charge and discharge cut-off voltage, etc.
[Electrode potential of lithium-ion battery material]
Electrode potential refers to the immersion of a solid material in the electrolyte solution, showing the electrical effect, that is, the potential difference between the surface of the metal and the solution. This potential difference is called the potential of the metal in the solution or the potential of the electrode. In short, the electrode potential is a tendency for an ion or atom to acquire an electron.
Therefore, for a certain positive electrode or negative electrode material, when placed in an electrolyte with a lithium salt, its electrode potential is expressed as:

Where φ c is the electrode potential of this substance. The standard hydrogen electrode potential was set to be 0.0V.
[Open-circuit voltage of the battery]
The electromotive force of the battery is the theoretical value calculated according to the reaction of the battery using the thermodynamic method, that is, the difference between the equilibrium electrode potential of the battery and the positive and negative electrodes when the circuit breaks is the maximum value that the battery can give the voltage. In fact, the positive and negative electrodes are not necessarily in the thermodynamic equilibrium state in the electrolyte, that is, the electrode potential established by the positive and negative electrodes of the battery in the electrolyte solution is usually not the equilibrium electrode potential, so the open-circuit voltage of the battery is generally smaller than its electromotive force. For the electrode reaction:

Considering the non-standard state of the reactant component and the activity (or concentration) of the active component over time, the actual open circuit voltage of the cell is modified by the energy equation:
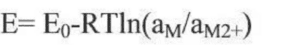
Where R is the gas constant, T is the reaction temperature, and a is the component activity or concentration. The open circuit voltage of the battery depends on the properties of the positive and negative electrode material, the electrolyte and the temperature conditions, and is independent of the geometry and size of the battery. Lithium ion electrode material preparation into the pole, and lithium metal sheet assembled into button half battery, can measure the electrode material in different SOC state of open voltage, open voltage curve is the electrode material charge state reaction, battery storage open voltage drop, but not very big, if the open voltage drop too fast or amplitude is abnormal phenomenon. The surface state change of the bipolar active substances and the self-discharge of the battery are the main reasons for the decrease of the open circuit voltage in storage, including the change of the mask layer of the positive and negative electrode material table; the potential change caused by the thermodynamic instability of the electrode, the dissolution and precipitation of metal foreign impurities, and the micro short circuit caused by the diaphragm between the positive and negative electrodes. When the lithium ion battery is aging, the change of K value (voltage drop) is the formation and stability process of the SEI film on the surface of the electrode material. If the voltage drop is too large, there is a micro-short circuit inside, and the battery is judged to be unqualified.
[Battery Polarization]
When the current passes through the electrode, the phenomenon that the electrode deviates from the equilibrium electrode potential is called polarization, and the polarization generates the overpotential. According to the causes of polarization, the polarization can be divided into ohmic polarization, concentration polarization and electrochemical polarization. FIG. 2 is the typical discharge curve of the battery and the influence of various polarization on the voltage.
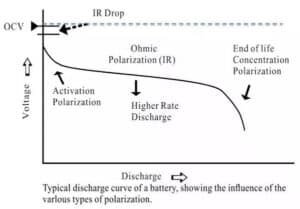
Figure 1. Typical discharge curve and polarization
(1) Ohmic polarization: caused by the resistance of each part of the battery, the pressure drop value follows ohm's law, the current decreases, the polarization decreases immediately, and the current disappears immediately after it stops.
(2) Electrochemical polarization: the polarization is caused by the slow electrochemical reaction on the electrode surface. It decreased significantly within the microsecond level as the current becomes smaller.
(3) Concentration polarization: due to the retardation of the ion diffusion process in the solution, the concentration difference between the surface of the electrode and the solution body is polarized under a certain current. This polarization decreases or disappears as the electric current decreases at the macroscopic seconds (a few seconds to tens of seconds).
The internal resistance of the battery increases with the increase of the discharge current of the battery, which is mainly because the large discharge current increases the polarization trend of the battery, and the larger the discharge current, the more obvious the polarization trend, as shown in Figure 2. According to Ohm's law: V=E0-IRT, with the increase of the internal overall resistance RT, the time required for the battery voltage to reach the discharge cut-off voltage is correspondingly reduced, so the release capacity is also reduced.
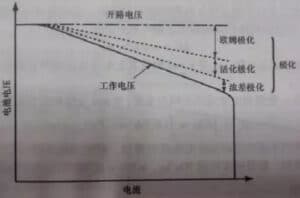
Figure 2. Effect of the current density on the polarization
Lithium ion battery is essentially a kind of lithium ion concentration battery. The charge and discharge process of lithium ion battery is the process of embedding and stripping of lithium ions in the positive and negative electrodes. Factors affecting the polarization of lithium-ion batteries include:
(1) The influence of electrolyte: the low conductivity of electrolyte is the main reason for the polarization of lithium ion batteries. In the general temperature range, the conductivity of the electrolyte used for lithium-ion batteries is generally only 0.01~0.1S/cm, which is one percent of the aqueous solution. Therefore, when lithium-ion batteries discharge at a high current, it is too late to supplement Li + from the electrolyte, and the polarization phenomenon will occur. Improving the conductivity of the electrolyte is the key factor to improve the high-current discharge capacity of lithium-ion batteries.
(2) The influence of positive and negative materials: the longer channel of positive and negative material large lithium ion particles diffusion to the surface, which is not conducive to large rate discharge.
(3) Conductor agent: the content of conductive agent is an important factor affecting the discharge performance of high ratio. If the content of conductive agent in the cathode formula is insufficient, the electrons cannot be transferred in time when the large current is discharged, and the polarization internal resistance increases rapidly, so that the battery voltage is quickly reduced to the discharge cut-off voltage.
(4) The influence of pole design: pole thickness: in the case of large current discharge, the reaction speed of active substances is very fast, which requires lithium ion to be quickly embedded and detached in the material. If the pole plate is thick and the path of lithium ion diffusion increases, the direction of pole thickness will produce a large lithium ion concentration gradient.
Compaction density: the compaction density of the pole sheet is larger, the pore becomes smaller, and the path of lithium ion movement in the pole sheet thickness direction is longer. In addition, if the compaction density is too large, the contact area between the material and the electrolyte decreases, the electrode reaction site is reduced, and the internal resistance of the battery will also increase.
(5) The influence of SEI membrane: the formation of SEI membrane increases the resistance of the electrode / electrolyte interface, resulting in voltage hysteresis or polarization.
[Operating voltage of the battery]
Operating voltage, also known as end voltage, refers to the potential difference between the positive and negative electrodes of the battery when the current flows in the circuit in the working state. In the working state of battery discharge, when the current flows through the battery, the resistance caused by the internal resistance should be overcome, which will cause ohmic pressure drop and electrode polarization, so the working voltage is always lower than the open circuit voltage, and when charging, the end voltage is always higher than the open circuit voltage. That is, the result of polarization makes the end voltage of the battery discharge lower than the electromotive potential of the battery, which is higher than the electromotive potential of the battery in charge.
Due to the existence of polarization phenomenon, the instantaneous voltage and the actual voltage in the process of charge and discharge. When charging, the instantaneous voltage is slightly higher than the actual voltage, the polarization disappears and the voltage drops when the instantaneous voltage and the actual voltage decreases after the discharge.
To summarize the above description, the expression is:
![]()
E +, E- -represent the potentials of the positive and negative electrodes, respectively, E + 0 and E- -0 represent the equilibrium electrode potential of the positive and negative electrodes, respectively, VR represents the ohmic polarization voltage, and η +, η - -represent the overpotential of the positive and negative electrodes, respectively.
[Basic principle of discharge test]
After a basic understanding of the battery voltage, we began to analyze the discharge curve of lithium-ion batteries. The discharge curve basically reflects the state of the electrode, which is the superposition of the state changes of the positive and negative electrodes.
The voltage curve of lithium-ion batteries throughout the discharge process can be divided into three stages
1) In the initial stage of the battery, the voltage drops rapidly, and the greater the discharge rate, the faster the voltage drops;
2) The battery voltage enters a slow change stage, which is called the platform area of the battery. The smaller the discharge rate,
The longer the duration of the platform area, the higher the platform voltage, the slower the voltage drop.
3) When the battery power is nearly finished, the battery load voltage begins to drop sharply until the discharge stop voltage is reached.
During testing, there are two ways to collect data
(1) Collect the data of current, voltage and time according to the set time interval Δ t;
(2) Collect the current, voltage and time data according to the set voltage change difference Δ V. The accuracy of charging and discharging equipment mainly includes current accuracy, voltage accuracy and time precision. Table 2 shows the equipment parameters of a certain charging and discharging machine, where% FS represents the percentage of the full range, and 0.05%RD refers to the measured error within the range of 0.05% of the reading. Charge and discharge equipment generally use CNC constant current source instead of load resistance for load, so that the output voltage of the battery has nothing to do with the series resistance or parasitic resistance in the circuit, but only related with the voltage E and internal resistance r and the circuit current I of the ideal voltage source equivalent to the battery. If the resistance is used for load, set the voltage of the ideal voltage source of the battery equivalent to be E, the internal resistance is r, and the load resistance is R. Measure the voltage at both ends of the load resistance with the voltage meter, as shown in the above figure in Figure 6. However, in practice, there are lead resistance and fixture contact resistance (uniform parasitic resistance) in the circuit. The equivalent circuit diagram shown in FIG. 3 is shown in the following figure of FIG. 3. In practice, the parasitic resistance is inevitably introduced, so that the total load resistance becomes large, but the measured voltage is the voltage at both ends of the load resistance R, so the error is introduced.
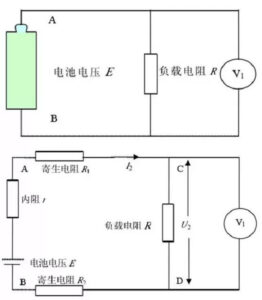
Fig. 3 The principle block diagram and the actual equivalent circuit diagram of the resistance discharge method
When the constant current source with the current I1 is used as the load, the schematic diagram and the actual equivalent circuit diagram are shown in Figure 7. E, I1 are constant values and r is constant for a certain time.
![]()
From the above formula, we can see that the two voltages of A and B are constant, that is, the output voltage of the battery is unrelated to the size of the series resistance in the loop, and of course, it has nothing to do with the parasitic resistance. In addition, the four-terminal measurement mode can achieve a more accurate measurement of the battery output voltage.
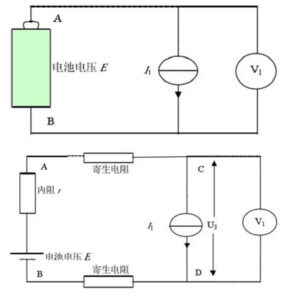
Figure 4 Equiple block diagram and actual equivalent circuit diagram of constant current source load
Concurrent source is a power supply device that can provide constant current to the load. It can still keep the output current constant when the external power supply fluctuates and the impedance characteristics change.
[Discharge test mode]
Charge and discharge test equipment generally uses the semiconductor device as the flow element. By adjusting the control signal of the semiconductor device, it can simulate a load of different characteristics such as constant current, constant pressure and constant resistance and so on. The lithium-ion battery discharge test mode mainly includes constant current discharge, constant resistance discharge, constant power discharge, etc. In each discharge mode, the continuous discharge and the interval discharge can also be divided, in which according to the length of time, the interval discharge can be divided into intermittent discharge and pulse discharge. During the discharge test, the battery discharges according to the set mode, and stops discharging after reaching the set conditions. The discharge cut-off conditions include setting voltage cut-off, setting time cut-off, setting capacity cut-off, setting negative voltage gradient cut-off, etc. The change of the battery discharge voltage is related to the discharge system, that is, the change of the discharge curve is also affected by the discharge system, including: discharge current, discharge temperature, discharge termination voltage; intermittent or continuous discharge. The larger the discharge current, the faster the operating voltage drops; with the discharge temperature, the discharge curve changes gently.
(1) Constant current discharge
When the constant current discharge, the current value is set, and then the current value is reached by adjusting the CNC constant current source, so as to realize the constant current discharge of the battery. At the same time, the end voltage change of the battery is collected to detect the discharge characteristics of the battery. Constant current discharge is the discharge of the same discharge current, but the battery voltage continues to drop, so the power continues to drop. Figure 5 is the voltage and current curve of the constant current discharge of lithium-ion batteries. Due to the constant current discharge, the time axis is easily converted to the capacity (the product of current and time) axis. Figure 5 shows the voltage-capacity curve at constant current discharge. Constant current discharge is the most commonly used discharge method in lithium-ion battery tests.
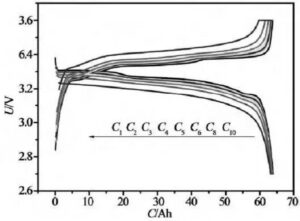
Figure 5 constant current constant voltage charging and constant current discharge curves at different multiplier rates
(2) Constant power discharge
When the constant power discharges, the constant power power value P is set first, and the output voltage U of the battery is collected. In the discharge process, P is required to be constant, but U is constantly changing, so it is necessary to continuously adjust the current I of the CNC constant current source according to formula I = P / U to achieve the purpose of constant power discharge. Keep the discharge power unchanged, because the voltage of the battery continues to drop during the discharge process, so the current in the constant power discharge continues to rise. Due to the constant power discharge, the time coordinate axis is easily converted into the energy (the product of power and time) coordinate axis.
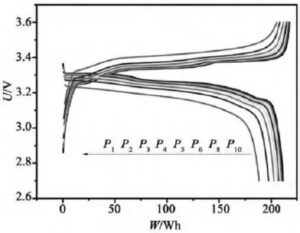
Figure 6 Constant power charging and discharging curves at different doubling rates
Comparison between constant current discharge and constant power discharge
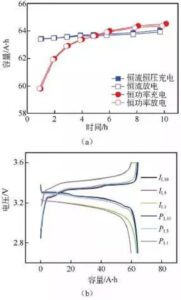
Figure 7: (a) charge and discharge capacity diagram at different ratios; (b) charge and discharge curve
Figure 7 shows the results of different ratio charge and discharge tests in the two modes of lithium iron phosphate battery. According to the capacity curve in FIG. 7 (a), with the increase of the charge and discharge current in the constant current mode, the actual charge and discharge capacity of the battery gradually decreases, but the change range is relatively small. The actual charge and discharge capacity of the battery gradually decreases with the increase of power, and the larger the multiplier, the faster the capacity decay. The 1 h rate discharge capacity is lower than the constant flow mode. At the same time, when the charge-discharge rate is lower than the 5 h rate, the battery capacity is higher under the constant power condition, while the battery capacity is higher than the 5 h rate is higher under the constant current condition.
From figure 7 (b) shows the capacity-voltage curve, under the condition of low ratio, lithium iron phosphate battery two mode capacity-voltage curve, and charge and discharge voltage platform change is not big, but under the condition of high ratio, constant current-constant voltage mode of constant voltage time significantly longer, and charging voltage platform increased significantly, discharge voltage platform is significantly reduced.
(3) Constant resistance discharge
When constant resistance discharge, a constant resistance value R is set first to collect the output voltage of the battery U. During the discharge process, R is required to be constant, but U is constantly changing, so the current I value of CNC constant current source should be constantly adjusted according to formula I=U / R to achieve the purpose of constant resistance discharge. The voltage of the battery is always decreasing in the discharge process, and the resistance is the same, so the discharge current I is also a decreasing process.
(4) Continuous discharge, intermittent discharge and pulse discharge
The battery is discharged in constant current, constant power and constant resistance, while using the timing function to realize the control of continuous discharge, intermittent discharge and pulse discharge. Figure 11 shows the current curves and voltage curves of a typical pulse charge / discharge test.
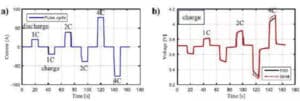
Figure 8 Current curves and voltage curves for typical pulse charge-discharge tests
[Information included in the discharge curve]
Discharge curve refers to the curve of the voltage, current, capacity and other changes of the battery over time during the discharge process. The information contained in the charge and discharge curve is very rich, including the capacity, energy, working voltage and voltage platform, the relationship between the electrode potential and the state of charge, etc. The main data recorded during the discharge test is the time evolution of the current and voltage. Many parameters can be obtained from these basic data. The following details the parameters that can be obtained by the discharge curve.
(1) Voltage
In the discharge test of lithium ion battery, the voltage parameters mainly include voltage platform, median voltage, average voltage, cut-off voltage, etc. The platform voltage is the corresponding voltage value when the voltage change is minimum and the capacity change is large, which can be obtained from the peak value of dQ / dV. The median voltage is the corresponding voltage value of half of the battery capacity. For materials more obvious on the platform, such as lithium iron phosphate and lithium titanate, the median voltage is the platform voltage. The average voltage is the effective area of the voltage-capacity curve (i. e., battery discharge energy) divided by the capacity calculation formula is u = U (t) * I (t) dt / I (t) dt. The cut-off voltage refers to the minimum voltage allowed when the battery discharges. If the voltage is lower than the discharge cut-off voltage, the voltage at both ends of the battery will drop rapidly, forming excessive discharge. Overdischarge may cause damage to the active substance of the electrode, lose the reaction ability, and shorten the battery life. As described in the first part, the voltage of the battery is related to the charge state of the cathode material and the electrode potential.
(2) Capacity and specific capacity
Battery capacity refers to the amount of electricity released by the battery under a certain discharge system (under a certain discharge current I, discharge temperature T, discharge cut-off voltage V), indicating the ability of the battery to store energy in Ah or C. Capacity is affected by many elements, such as discharge current, discharge temperature, etc. The capacity size is determined by the amount of active substances in the positive and negative electrodes.
Theoretical capacity: the capacity given by the active substance in the reaction.
Actual capacity: the actual capacity released under a certain discharge system.
Rated capacity: refers to the minimum amount of power guaranteed by the battery under the designed discharge conditions.
In the discharge test, the capacity is calculated by integrating the current over time, i. e. C = I (t) dt, constant current in t constant discharge, C = I (t) dt = I t; constant resistance R discharge, C = I (t) dt = (1 / R) * U (t) dt (1 / R) * out (u is the average discharge voltage, t is the discharge time).
Specific capacity: In order to compare the different batteries, the concept of specific capacity is introduced. Specific capacity refers to the capacity given by the active substance of the unit mass or the unit volume electrode, which is called the mass specific capacity or the volume specific capacity. The usual calculation method is: specific capacity = battery first discharge capacity / (active substance mass * active substance utilization rate)
Factors affecting the battery capacity:
a. The discharge current of the battery: the larger the current, the output capacity decreases;
b. Discharge temperature of the battery: when the temperature decreases, the output capacity decreases;
c. The discharge cut-off voltage of the battery: the discharge time set by the electrode material and the limit of the electrode reaction itself is generally 3.0V or 2.75V.
d. Charge and discharge times of the battery: after multiple charge and discharge of the battery, due to the failure of the electrode material, the battery will be able to reduce the discharge capacity of the battery.
e. The charging conditions of the battery: charging rate, temperature, cut-off voltage affect the capacity of the battery, thus determining the discharge capacity.
Method of determination of battery capacity:
Different industries have different test standards according to the working conditions. For lithium-ion batteries for 3C products, according to the national standard GB / T18287-2000 General Specification for Lithium-ion Batteries for Cellular Telephone, the rated capacity test method of the battery is as follows: a) charging: 0.2C5A charging; b) discharge: 0.2C5A discharging; c) five cycles, of which one is qualified.
For the electric vehicle industry, according to the national standard GB / T 31486-2015 Electrical Performance Requirements and Test Methods for Power Battery for Electric Vehicles, the rated capacity of the battery refers to the capacity (Ah) released by the battery at room temperature with 1I1 (A) current discharge to reach the termination voltage, in which I1 is 1 hour rate discharge current, whose value is equal to C1 (A). The test method is:
A) At room temperature, stop the constant voltage when charging with constant current charging to the charging termination voltage specified by the enterprise, and stop the charging when the charging termination current drops to 0.05I1 (A), and hold the charging for 1h after charging.
Bb) At room temperature, the battery is discharged with 1I1 (A) current until the discharge reaches the discharge termination voltage specified in the enterprise technical conditions;
C) measured discharge capacity (measured by Ah), calculate the discharge specific energy (measured by Wh / kg);
3 d) Repeat steps a) -) c) 5 times. When the extreme difference of 3 consecutive tests is less than 3% of the rated capacity, the test can be finished in advance and the results of the last 3 tests can be averaged.
(3) State of charge, SOC
SOC (State of Charge) is a state of charge, representing the ratio of the remaining capacity of the battery to its full charging state after a period of time or a long time under a certain discharge rate. The method of "open-circuit voltage + hour-time integration" method uses the open-circuit voltage method to estimate the initial state charge capacity of the battery, and then uses the hour-time integration method to obtain the power consumed by the a-time integration method. The power consumed is the product of the discharge current and the discharge time, and the remaining power is equal to the difference between the initial power and the power consumed. The SOC mathematical estimate between open circuit voltage and an-hour integral is:
![]()
Where CN is the rated capacity; η is the charge-discharge efficiency; T is the battery use temperature; I is the battery current; t is the battery discharge time.
DOD (Depth of Discharge) is the discharge depth, a measure of the discharge degree, which is the percentage of the discharge capacity to the total discharge capacity. The depth of discharge has a great relationship with the life of the battery: the deeper the discharge depth, the shorter the life. The relationship is calculated for SOC = 100% -DOD
4) Energy and specific energy
The electric energy that the battery can output by doing external work under certain conditions is called the energy of the battery, and the unit is generally expressed in wh. In the discharge curve, the energy is calculated as follows: W = U (t) * I (t) dt. At constant current discharge, W = I * U (t) dt = It * u (u is the average discharge voltage, t is the discharge time)
a. Theoretical energy
The discharge process of the battery is in an equilibrium state, and the discharge voltage maintains the value of electromotive force (E), and the utilization rate of the active substance is 100%. Under this condition, the output energy of the battery is the theoretical energy, that is, the maximum work done by the reversible battery under constant temperature and pressure.
b. The actual energy
The actual output energy of the battery discharge is called the actual energy, the electric vehicle industry regulations ("GB / T 31486-2015 Power Battery Electrical Performance Requirements and Test Methods for electric Vehicles"), the battery at room temperature with 1I1 (A) current discharge, to reach the energy (Wh) released by the termination voltage, called the rated energy.
c. specific energy
The energy given by a battery per unit mass and per unit volume is called mass specific energy or volume specific energy, also called energy density. In units of wh / kg or wh / L.
[Basic form of the discharge curve]
The most basic form of the discharge curve is the voltage-time and current time curve. Through the transformation of the time axis calculation, the common discharge curve also has the voltage-capacity (specific capacity) curve, voltage-energy (specific energy) curve, voltage-SOC curve and so on.
(1) Voltage-time and current time curve
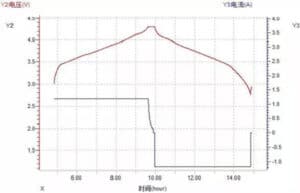
Figure 9 Voltage-time and current-time curves
(2) Voltage-capacity curve
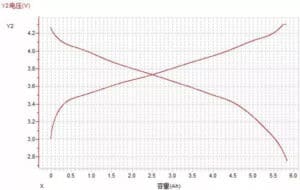
Figure 10 Voltage-capacity curve
(3) Voltage-energy curve
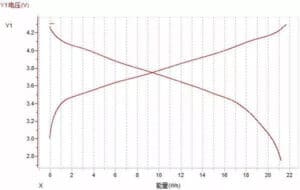
Figure Figure 11. Voltage-energy curve
[reference documentation]
- Wang Chao, et al. Comparison of charge and discharge characteristics of constant current and constant power in electrochemical energy storage devices [J]. Energy storage science and technology.2017(06):1313-1320.
- Eom K S,Joshi T,Bordes A,et al.The design of a Li-ion full cell battery using a nano silicon and nano multi-layer graphene composite anode[J]
- Guo Jipeng, et al. Comparison of the constant current and constant power test characteristics of lithium iron phosphate batteries [J].storage battery.2017(03):109-115
- Marinaro M,Yoon D,Gabrielli G,et al.High performance 1.2 Ah Si-alloy/Graphite|LiNi0.5Mn0.3Co0.2O2 prototype Li-ion battery[J].Journal of Power Sources.2017,357(Supplement C):188-197.

